Array Analysis Tools
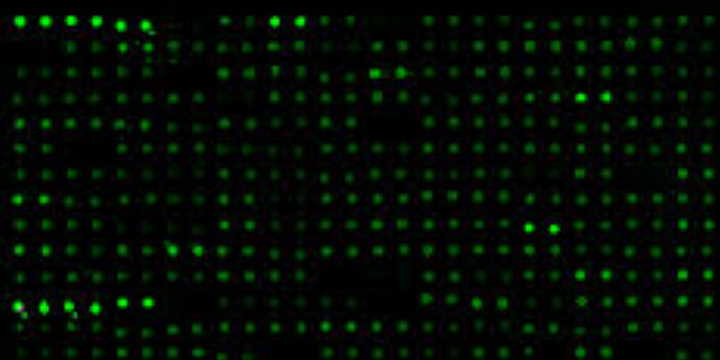
RayBiotech supports each antibody array kit by offering Excel-based analysis software tools for the automatic computation of the extracted numerical data obtained from the array image. Features include sorting, averaging, background subtraction, positive control normalization, and histogram graphing for easy visual comparison.
The analysis tools combine the familiarity of Excel with RayBiotech’s innovative antibody array technology to create a program that even the most novice researcher can easily use. The array data obtained from densitometry is merely inputted into the appropriate cells of the corresponding analysis tool and the tool does the rest. They take the slow and tedious process of manually analyzing the enormous amount outputted data associated with multiplex assays like antibody arrays and simplifies the process to “copy and paste”.
The Q-Analyzer®, a software tool created specifically for the Quantibody array, will plot the standard curve for each analyte in addition to performing background subtraction/normalization. After imaging the slide with a laser scanner and extracting the densitometry values, protein quantification can be performed with virtually any ELISA analysis software. However, our array-specific Q-Analyzer® tool facilitates the process. Instead of tedious calculation of each analyte, the user can rapidly plot all the standard curves simultaneously in both linear regression and log-log models. The program removes outlier spots for greater accuracy, and then outputs the unknown sample concentrations automatically.
Highlights
- Automatically analyzes antibody array data
- Generates graphs for easy visual comparison
- Excel-based software
- Fast and Easy to use - “Copy and Paste”
- Q-Analyzer® plots standard curves in both linear regression and log-log models.
